3-D Microscope Using Diffraction Grating
Tom DeWitt
DeWitt Brothers Tool Company, Inc.
DeWitt Pond
Ancramdale, NY 12503
Douglas Lyon
Computer Science and Engineering Department
Bridgeport, CT 06460
E-mail: Lyon@cse.bridgeport.edu
An optical microscope has been adapted for 3-D inspection of small capillaries in thread spinnerets by placing a diffraction grating between the microscope objective and the specimen. We show how a grating was specified using a quantitative analysis of groove spacing and geometry. An illumination system was specified based on incident angle and light wavelength. Specimens are placed on a robotic stage for positioning, and repositioning affords multiple perspective views of the target depending upon the diffraction order visible to the objective.
We have previously demonstrated the diffraction range finding technique for depth measurements on convex or moderately convex surfaces [DeWitt and Lyon]. Holes (concavities with parallel walls) are typically occluded when ranging with triangulation. We have quickly compared our near-field diffraction method with other range-finding technologies, including focus analysis, interferometry, moiré and time-of-flight methds (sonar, lidar and radar) [DeWitt and Lyon]. More work remains to be done to determine the trade-offs of our approach versus these other techniques. However, even though holes are commonplace in manufactured products, none of these techniques are ubiquitious for hole measurement.
A key parameter in designing a hole metrology system is occlusion liability, that is, the shadowing effect caused by the hole walls. This parameter particularly affects triangulation methods, because their readings are based on the angular off-set between a transmitter and a receiver. We compare triangulation with our diffraction method in Figure 1 on the following page. Occlusion liability is inscribed as angle ß, and can be determined for a triangulation system by measurement of the hole diameter dh and the hole length L .
(1) ![]()
We use the hole radius (1/2 dh) in our calculation, as shown in Figure 1(a), because the entire floor of the hole can then be sampled. Note that for triangulation systems, the mechanism for scanning requires a reverse of orientation of the target hole to acquire the occluded half of the hole, as indicated by a shaded line on the lower left hand side of the hole illustrated in Figure 1(a).
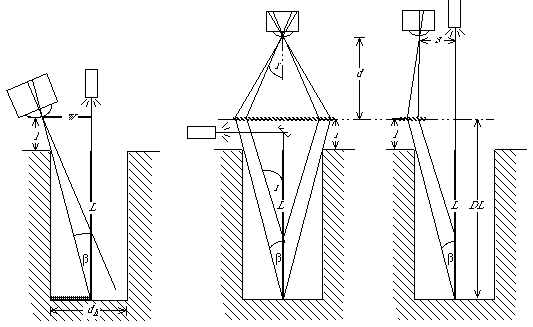 (a) Triangulation (b) Co-axial
Diffraction (c) Off-axis Diffraction
Figure 1. Comparison of triangulation (a) with diffraction (b & c) hole metrology.
In a practical device, a stand-off l exists between the receiver and the lip of the hole. The baseline w between the illumination and the receiver can be determined using:
(2) ![]()
The occlusion liability angle ß can then be calculated using:
(3) ![]()
To determine the occlusion liability angle for a diffraction range finder, we invoke the Grating Equation itself:
(4) ![]()
where n = diffraction order, an integer
[[lambda]] = wave length of illumination
p = grating pitch
i = angle of diffracted ray subtended from target onto the grating
r = angle of diffraction image at the receiver
If we define the occlusion liability angle ß as i, then using equation (3) we can say:
(4) ![]()
Using equations (7) & (8) from [DeWitt and Lyon] we can say that when the grating is perpendicular to the hole as illustrated in Figure 1(b&c) angle r can be determined for any particular depth using the relationship:
(5) 
where ![]()
and s = spacing between illumination and receiver
d = grating to receiver distance
The reduction-to-practice of diffraction hole metrology that guided our project involved the Aspex SpinTrak CMM(TM) [Aspex]. The market version of this unit performs automated 2-D inspection of thread spinnerets. A schematic diagram of the apparatus appears as Figure 2 below.
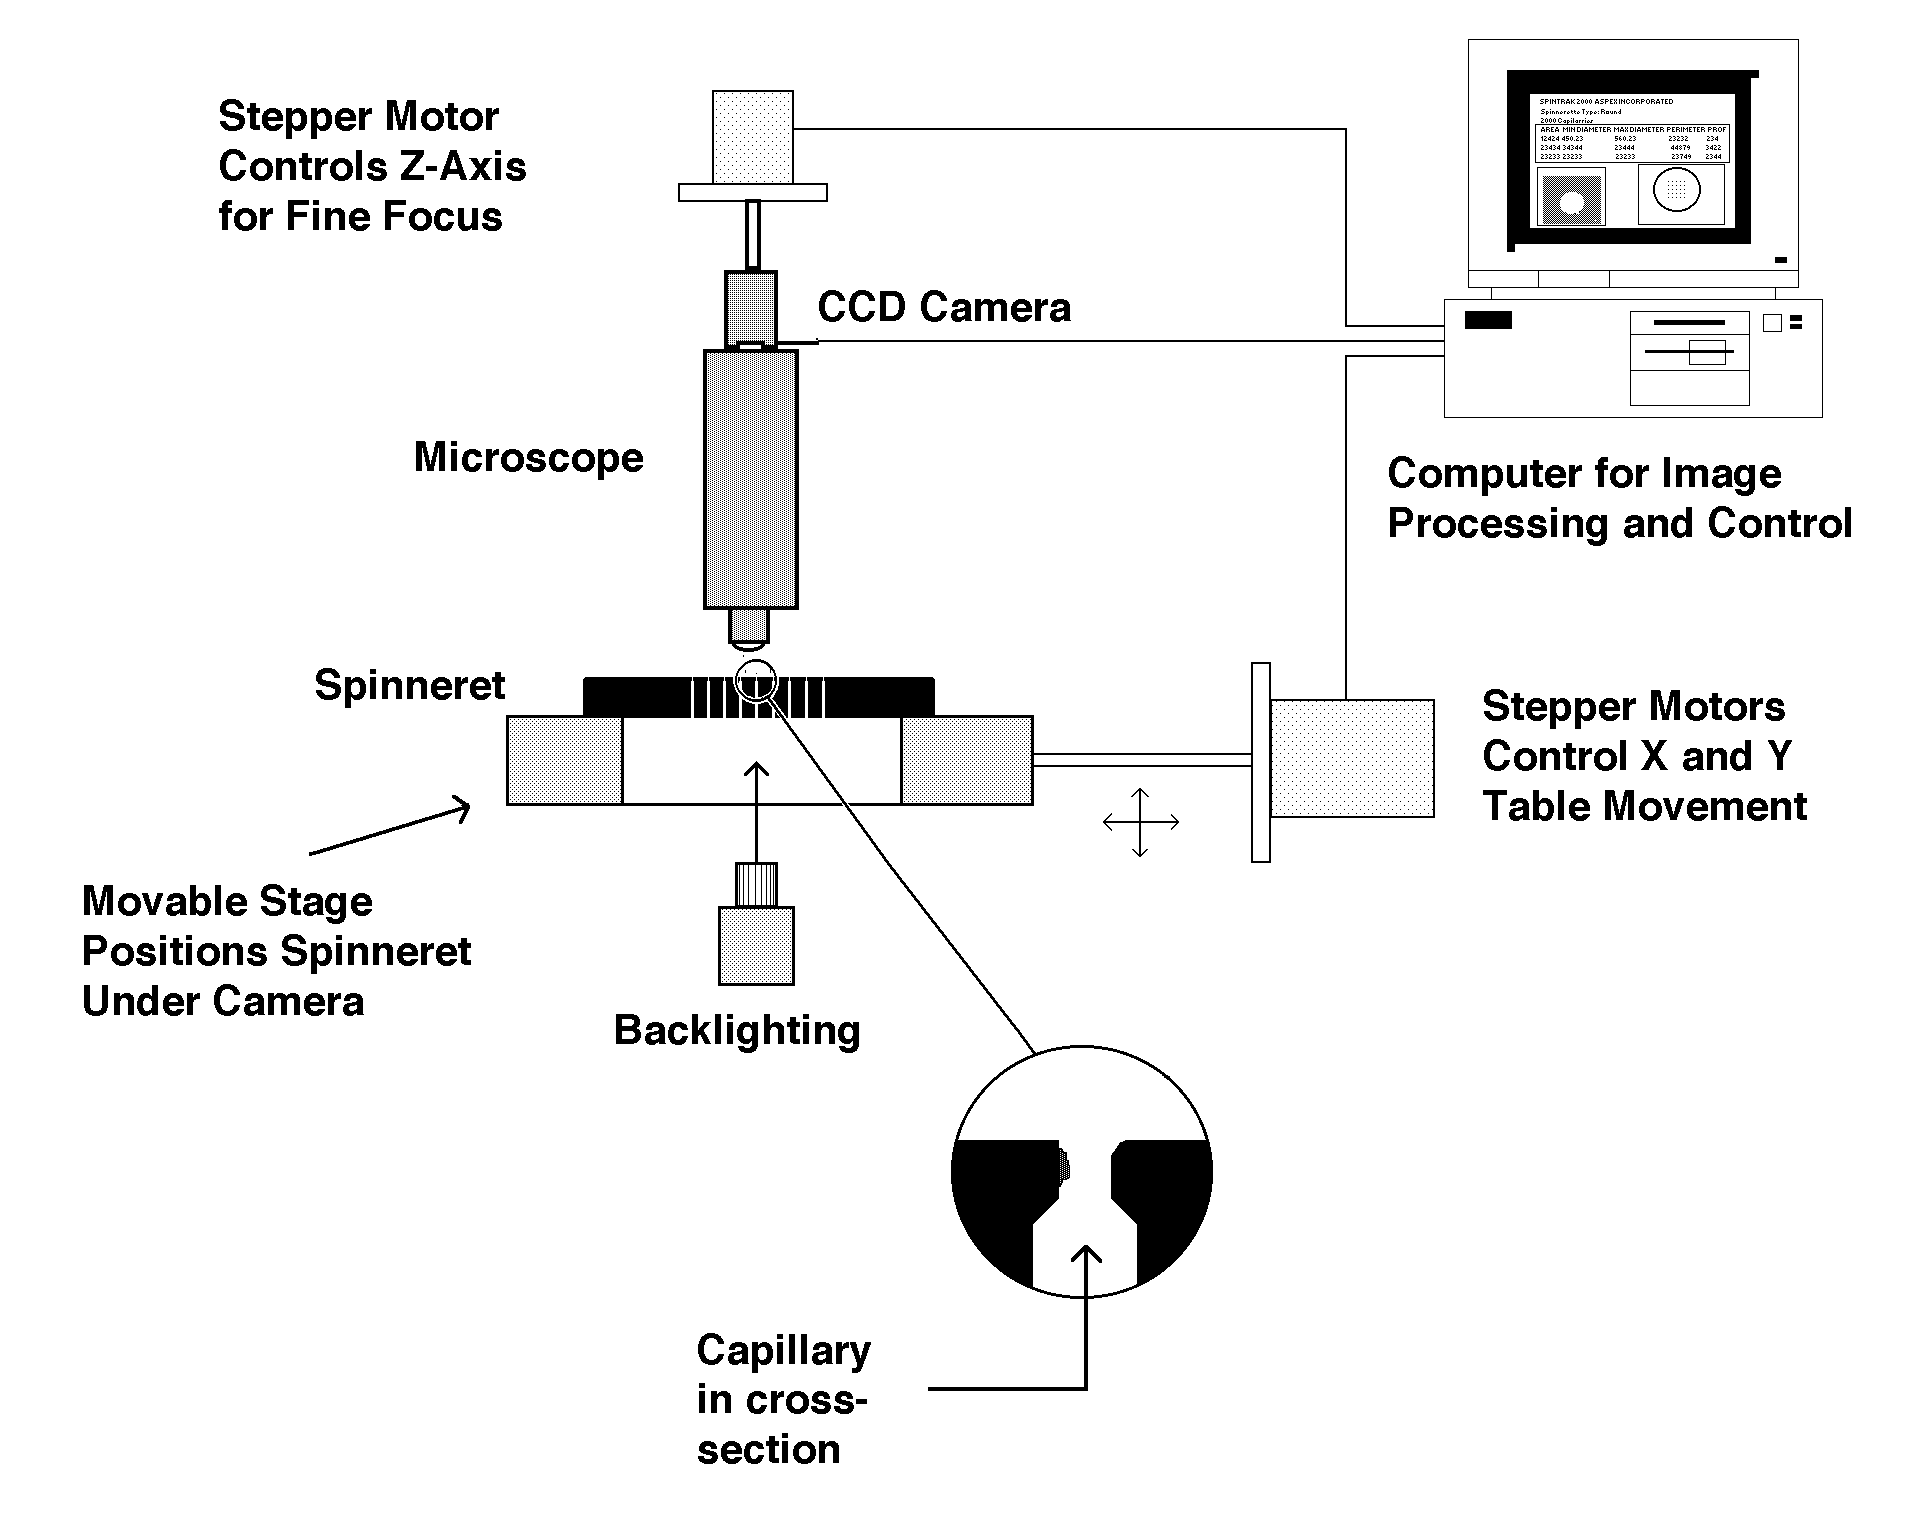
Figure 2. Schematic representation of the Aspex SpinTrak Automatic inspection CMM.
Each spinneret has dozens to thousands of tiny holes called capillaries which eject threads as part of an extrusion manufacturing process. The Aspex SpinTrak product currently on the market can detect blockages and breaches in the capillaries but cannot measure capillary depth, an important evaluation parameter requested by many users of the device. For this reason Aspex entertained our proposal to develop a 3-D metrology capability for their product.
Triangulation can be used to make measurements of capillary depth using the configuration illustrated in Figure 1(a), and as part of this research we experimented with a triangulation set-up using the Aspex microscope. The experimental bench unit is illustrated in Figure 3 on the following page along with examples of an acquired image, shown in Figure 4.
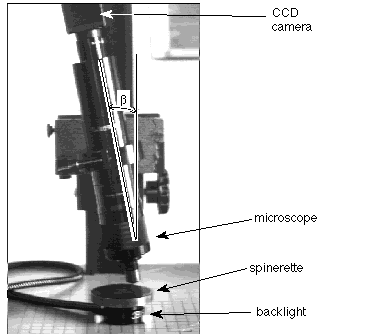
Figure 3. Experimental triangulation set-up
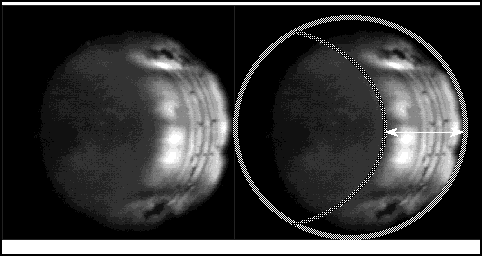
Figure 4. Triangulation view of hole. Right view diagrams method for depth measurement.
Referring to Figure 3, ß is measured at 12[[ring]]. This is the rotation of the microscope which was used to capture the image shown in Figure 4. An overlay is used in the Figure 4 right hand image to indicate how hole depth could be measured. While the bottom of the hole can be distinguished clearly, short depth-of-field in the microscope obscures the lip of the hole, and this must be estimated. The hole depth is proportional to the distance indicated by the arrow.
The Aspex SpinTrak does not enjoy the option of rotating the microscope, since its 2-D metrology depends on a precise vertical alignment of the microscope. This alignment is so precise that the microscope is rigidly fixed to a bridge. A photograph of a typical SpinTrak unit is shown in Figure 5 below.
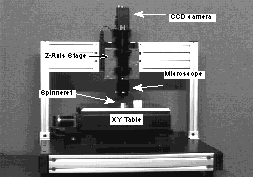 Figure 5. Aspex SpinTrak 2000
The diffraction method provides the SpinTrak with the equivalent of a rotation of the optical axis while maintaining true vertical alignment of the microscope. Moreover, the multiple spectra of diffraction in their plus and minus orders provide a plethora of views at different positions and powers of magnification.
A series of experiments were conducted using the test bed previously used for triangulation studies. However, the microscope was positioned perpendicular to the plane of the test spinneret. A grating with a pitch of 5.55 um was placed on a glass slide above the spinneret. For rear illumination, a fiber optic ring, normally used as a front illuminator, was placed under the spinneret. This method of illumination, which was also used to produce Figure 4, provided a moderately focused beam inside the spinneret cavity leading to the capillary. Figure 6 on the next page shows the distal end of the fiber optic array.

Figure 6. Fiber optic illumination bundle distal end.
The multi-spectral illumination radiating from the fiber optic light source resulted in a blurred diffraction image seen below in Figure 7

Figure 7. Diffraction image in white light illumination.
Anticipating this problem, we had obtained a laser diode with a narrow band of spectral energy at a wavelength of 670 nm. This was used in place of the white light illumination source for the fiber optic bundle. However, the laser illumination was coherent and created a characteristic speckle pattern when imaged through the microscope as illustrated below.
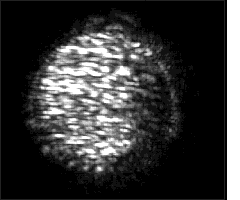
Figure 8. Laser illumination speckle. This is a zero-order image of a capillary hole.
A viable solution to the illumination problem was found by filtering the white light source with an interference filter. A 632.8 nm bandpass filter was obtained from a HeNe laser imaging lens. This was mounted inside the fiber optic illuminator housing in a line with the fiber optic bundle. The resultant image is shown on the following page as Figure 9.
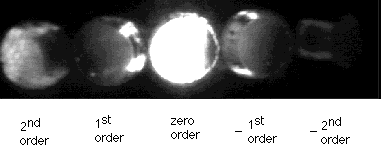
Figure 9. Diffraction image of target hole under filtered illumination.
Figure 9 shows an on-axis illumination view made with a configuration like that shown in Figure 1(b). This set-up permitted the simultaneous acquisition of four parallax views. The second order images provide greater input angles. Negative order images provide views of the hole from the opposite side of the positive orders. This is a useful feature when compared with triangulation. It provides only a single parallax view. With diffraction, the work piece does not need to be rotated to be seen from both sides. Grating groove shape specifications can determine the selection of multiple orders - either a single higher order or many higher orders. Moreover, in addition to symmetrical plus and minus higher-order views, opposed parallax views can be generated using a cross-hatch grating, that is, a grating with two opposed structures. An example is shown below in Figure 10.
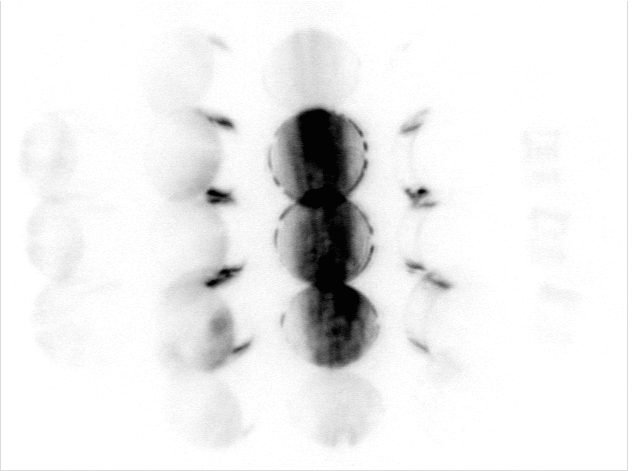
Figure 10. Two-dimensional parallax views made by using a cross-hatch grating.
In order to resolve fine detail within a higher-order diffraction image, the receiver must be moved off the illumination axis. Such a configuration is illustrated in Figure 1(c). Once off the illumination axis, a diffraction image can be formed in the center of the field-of-view of the receiver, and the receiver lens can be moved in the z-axis toward the target, allowing magnification. An example is given below in Figures 11 and 12.
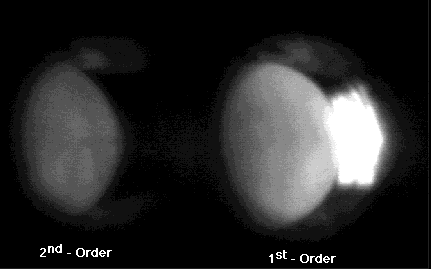
Figure 11. Magnification made possible by off-axis illumination configuration
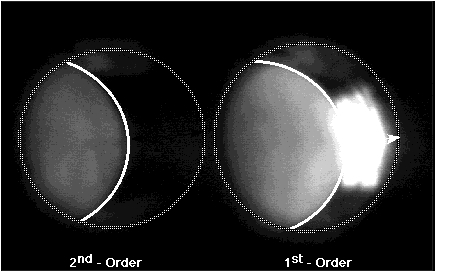
Figure 12. Determination of hole depth using detailed diffraction image
The XY translation and Z-axis zoom required to acquire the perspective views exampled in Figures 11 & 12 are completely compatible with the Aspex SpinTrak in its current form. A threaded collar that is supplied with the microscope itself can be used to hold the grating. Fiber optic illumination similar to the current modules supplied with the unit can be upgraded to accommodate the color bandpass and focus requirements specific to the diffraction method. A schematic of a prototype instrument is illustrated in Figure 13 below.
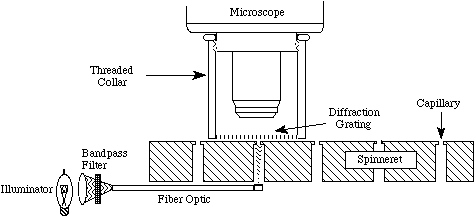
Figure 13. Diffraction range finder fitted to SpinTrak CMM
In addition to the configuration shown in Figure 13, we have investigated refinements for microscopic examination of cavities by the diffraction method exploiting gratings which have a frequency greater than the incident illumination. This technique requires both an offset of the source illumination and a rotation of the grating. It is discussed at some length in our recent Applied Optics article.
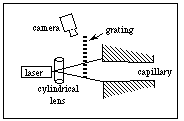 Figure 14. Proposed Range Finder
from SBIR funding request 7/94
The possibility exists to place the illumination on the same side of the hole as the grating. The illustration on the left which shows this type of geometric relationship. While this arrangement is not possible with the SpinTrak microscope, which must remain strictly vertical, we anticipated achieving equivalent geometries using relay assemblies fashioned from reflective surfaces. In this setup high frequency gratings have a potential for range magnification with low occlusion liability, and we examined them as part of our research.
Our inquiry confirmed the magnification effect we had anticipated. Using a test fixture modeled on Figure 14 we illuminated a 0.25 inch hole at various depths up to 1 inch and recorded images with a variety of macro lenses. These produced images shown on the following page in Figure 15.
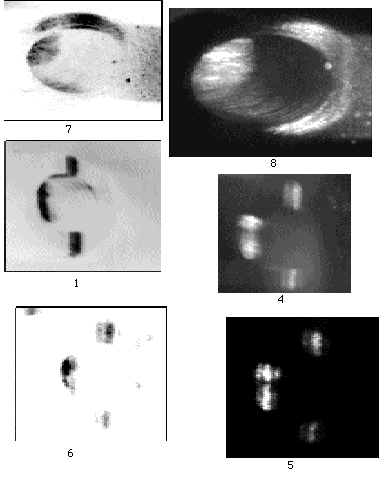
Figure 15. Examples of high frequency grating images. Negative on left; Positive on right. Top pair (7&8) illuminated by "flood" lighting. Other images illuminated by a laser stripe.
The oval shaped hole lip, best seen in Figure 15 (7&8) made by illuminating a large portion of the hole lip with a defocused laser, indicates the manner by which a high frequency grating can generate increased depth resolution. Since the depth measurement is made by determining the displacement between the lip and bottom of the hole, the elongation of the lip stretches the horizontal dimension effectively increasing depth resolution of the range finder. This phenomenon, well known with anamorphic lenses, is little studied in the literature as a diffraction feature and has promising potential. However, an artifact of internal reflection within the transmission gratings used in these experiments created a series of ambiguous multiple images This is noticeable in the broadening of the laser stripe in Figure 15 (4, 5 & 6) where the stripe appears to be striated in the horizontal dimension.
A close examination of the inner reflection phenomenon is shown in Figure 16 below. To produce this image, the target was illuminated with a point source rather than a stripe, and the camera recorded image was enlarged.
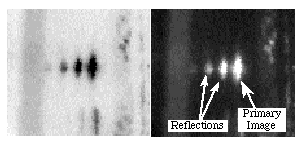
Figure 16. Inner reflections within a transmission grating. Negative and positive versions.
The obvious solution to the inner reflection problem with high frequency gratings is to use a reflection grating. However, the restrictions in orientation and size makes this a difficult design problem not within the resources of our current project.
We have investigated a diffraction-based method for measuring depth inside of holes. We developed geometric models for diffraction behavior which are more general than our prior characterizations of the effect, and a paper disclosing these new models appeared in [DeWitt and Lyon]. Using these models we have examined a variety of configurations for diffraction range finders which are specifically optimized for metrology in occluded spaces, and we have conducted a series of experiments to corroborate predictions drawn from these models. Finally, we have attempted to adapt the diffraction method to an extant co-ordinate measurement machine (CMM) built by Aspex [Aspex].
Finally, we wish to make clear that more work needs to be done in the area of comparison of our techniques with others in the field. We have not done this comparison and do not know under which circumstances our techniques might be better than others.
This research was supported by a grant from the New York State Science and Technology Foundation. We would like to express our appreciation for the assistance from all participatnts at Aspex, Inc.
[Aspex] Aspex, Inc., 536 Broadway, NY, NY 10012. Phone (212)966-0410.
[DeWitt and Lyon] DeWitt, T. and Lyon, D., "Rangefinding Method Using Diffraction Gratings", Applied Optics, May, 10, 1995 Vol 34, No. 14, pp. 2510-2521.